Week 30 Reflect on Your Evidence (Take Action)
To what extent does gamification impact on behavioural engagement for distance learners?
What?
The data that I have collected for my inquiry is qualitative and quantitative. My quantitative data was a tally of week one engagement through our My Te Kura portal and also again as endpoint data in week five. I chose this method of collecting data at it was a true representation if the student was logging into our online platform to access their learning content, which would then would show that they are engaging. I needed to gather baseline data and endpoint data this way so that I could make comparisons between the data and begin to analyse it.
This is a snapshot of my quantitative data from week one:

And week five:

I also collected weekly data for the weeks in between:


I also sent out a Google Form survey which looked at qualitative and quantitive data, which I sent out in week one and also week five to gather feedback on engagement and also ClassDojo. I sent this to the students and also to their supervisors as they work very closely with their students. I did this as I wanted to collect the wider picture around how both the students and the supervisors felt towards ClassDojo and if it would be worth continuing to use in my teaching practice looking forward and understanding the reasons why 'qualitative data is to bring meaning and order to the mass of collected data by looking for recurring themes,' (Efron, 2014, p.166).
This is a snapshot of some of the questions that I asked the supervisors in week one:


These are snapshots of some of the questions that I asked the students in week one:


I sent weeks one Google Form, with this added section in week five to gather feedback and opinions once ClassDojo had been used for four weeks:
Supervisor: Student:


I also took a snapshot of the ClassDojo classroom by the end of week five to show the final amount of Dojo points that had been allocated. I have had a lot more students join my class-list, however, I did not include these students in my inquiry purposes. I stuck to the original nine that I had from week one. I have blanked the names out for anonymity purposes as this was an ethical issue for me:

So what?
I have transferred the quantitative data that I collected in table form into a graph to analyse the results from weeks one and five. I chose a column graph as I believe it was the most appropriate type of data to show comparisons between the weeks.


For my qualitative data, I have categorised the answers to some questions in week one and also for week five. I have chosen to do this as a way to code the data as 'coding is an interpretive technique to sort text or visual images into categories that provide structure for interpretation,' (Babione, 2014, p.142).

And also week five:
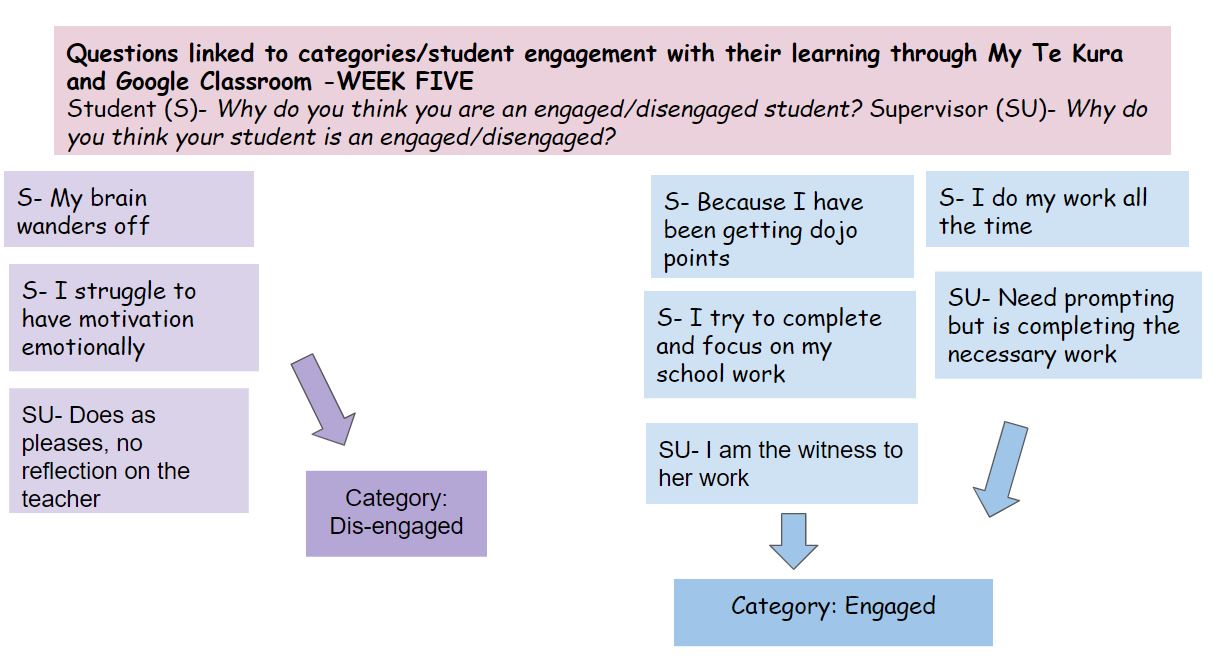
Now what?
My inquiry question was: To what extent does gamification impact on behavioural engagement for distance learners? Whilst looking at my quantitative data it clearly shows that by using ClassDojo and using the points scheme (gamification) it has made an impact. A positive impact. The graphs from the data that I collected show an increase of the students logging onto our My Te Kura platform and the ClassDojo points clearly show that students are engaging. Whilst looking at the qualitative data however, the impact of ClassDojo isn't as clear. In fact, it has shown that there was a higher dis-engagement level in week five when comparing it to week one. There may be a lot of factors that have impacted the feedback given, like personal circumstances around the time of sending the second form. However, this is something that I have taken on board, that perhaps although the data shows an increase, that maybe the students didn't enjoy the process as much as I thought they would have. It was clear that the supervisors thought ClassDojo was great, and they were enjoying using it, however, one student still didn't understand it. Why didn't they understand the process, because I thought that I had explained it all pretty clear to everyone? It has left me with some food for thought looking ahead. Because of this, I feel that I may have needed to collect more voice, more qualitative data, to help get to the bottom of why there was a higher level of dis-engagement in week five.
References:
Babione, C. (2014). Practitioner teacher inquiry and research. Retrieved from http://ebookcentral.proquest.com. Created from unitec on 2017-08-13 21:17:27.
Efron, S. E., & Ravid, R. (2013). Action research in education: A practical guide. New York, NY: The Guilford Press.
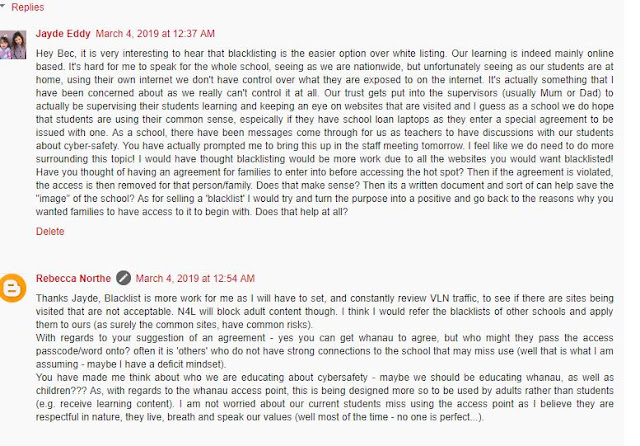
Online Participation:


Hi Louise, l was completely thrilled after looking at your data presented. It does show the commitment you have demonstrated and for me, many obstacles came my way but k took the challenges positively and looked at it with a learning point of view.
ReplyDeleteYour reflections clearly states your inquiry and how you have implemented the changes to enhance learning.
I also learnt from my inquiry on the different forms of engagement that learners goes through and their definition of engagement is so different to what we persevere.
But overall, your reflection is a learning opportunity for me as well.
Thanks for sharing.
Kia ora Jayde,
ReplyDeleteYou have collected a wide variety of data here to support your inquiry. I believe your inquiry has been a success as your focus was on behavioural engagement and the qualitative data reflected more on cognitive engagement than behavioural perhaps?
The large majority of your students behavioural engagement did increase over the period of your inquiry which was a success, and with any innovation there will be laggards so we know not everyone will positively take up new innovations and that too is ok. Perhaps moving forward finding a way that the learners can motivate and encourage each other in a collaborative tech space so not all of the encouragement is coming from you and they are hearing from their peers?
Congratulations on a job well done this term. All the best to you and your distance learners for the remainder of 2019 and beyond.
Ngā mihi
Kay
Hi Louise
ReplyDeleteyou data and graphs look amazing, its so satisfying in the end when you sit back and look at the success.
I also used a variety of platforms to engage my learners and engage with parents, its good to see we are communicating about learning with parents rather than only either receiving complains or talking negative about the child to the parent. I am just waiting on more parents to join the club and have more engagement in learning then anything else.
great success well done.
Hi Louise,
ReplyDeleteI'm a visual person and reading through your graphs I noticed huge improvement with student engagement . My inquiry focused on CRRPP and I was identifying engagement of Maori and Pasifika learners. At my school we have many students with devices, in addition, our school provides devices but too often our students are not meeting the expectations of learning using the devices. I would like to suggest to some of our departments to trial what you had set out as an option to hopefully, capture the interest of our learners.
Ia manuia.